This website uses cookies so that we can provide you with the best user experience possible. Cookie information is stored in your browser and performs functions such as recognising you when you return to our website and helping our team to understand which sections of the website you find most interesting and useful.
High-Performance Data Insight Software for PanFS
Maximizing the value of existing data is critical for high-performance computing (HPC), artificial intelligence, and machine learning (AI/ML) workloads. As unstructured data within organizations continues to scale to petabytes, under-standing that data becomes just as important as storing it.
Data-driven organizations need comprehensive insight into their storage environments to understand their space consumption and asset availability. Compounding this challenge, multiple vendors are often used for storage, creating data silos and storage islands. Organizations that lack insight into their data stores risk losing their competitive advantage.
Panasas provides PanView™ Analytics, a comprehensive and easy-to-use data insight solution for HPC and AI/ML environments that helps organizations extract full value from their data. Combined with the included PanMove™ Advanced soft-ware, users can discover, search, and analyze their data files to mobilize them where and when they are needed. PanMove Advanced and PanView Analytics are the result of a collaboration between Panasas and Atempo, a leading provider of data protection and data management software.
PanView Analytics provides clear analytical information and powerful search capabilities that result in better decision making and reduced operating costs for infrastructure and personnel. Users access PanView Analytics through a single centralized dashboard that presents a global view of Panasas storage systems as well as backup and archive destinations. PanView Analytics provides a graphical representation of the data lifecycle and creates customized reports.
State-of-the-art HPC and AI/ML solutions require storage solutions that are the highest in reliability, scalability, and performance, and they must also be simple to manage. Whether it’s pushing the boundaries in life sciences, manufacturing, energy, financial services, media and entertainment, or academic and government research, Panasas delivers the PanFS parallel file system with the PanFS software suite that includes PanView Analytics for high-performance data insights.
PanView Analytics Benefits
- Reduce total cost of ownership (TCO) by optimizing different storage tiers.
- Analyze data usage metrics.
- Identify data via metadata.
- Gain global understanding of storage and data.
Take Action
With PanView, customers are enabled to act on their infra-structure and data:
- File metadata visibility (date, size, type, etc.).
- Capacity planning and keeping storage costs under control.
- Consolidating storage from multiple silos.
- Identifying “cold” data to transfer to lower-cost storage.
View Reports
PanView is accessed through a single centralized dash-board:
- Global view of Panasas storage systems and backup and archive destinations.
- Graphical representation of data lifecycle (“hot” and “cold” data).
- Consolidated views and creation of customized reports.
ActiveStor Storage Nodes
PanView Analytics is supported on ActiveStor® Ultra, ActiveStor® Flash, ActiveStor® Ultra XL, and ActiveStor® Classic storage nodes. All nodes are visible through the same graphical interface.
Web Interface
PanView Analytics comes with an easy-to-use Web interface that is includes a navigation pane providing access to the following tabs:
- Dashboard – Present information on the selected resource and customize the dashboard to show metrics and analytics.
- Analytics – Explore and organize metrics for the select-ed time period and resource types.
- Search – Perform advanced file search operations by path, file name and tag.
- Log out – Sign out from the application.
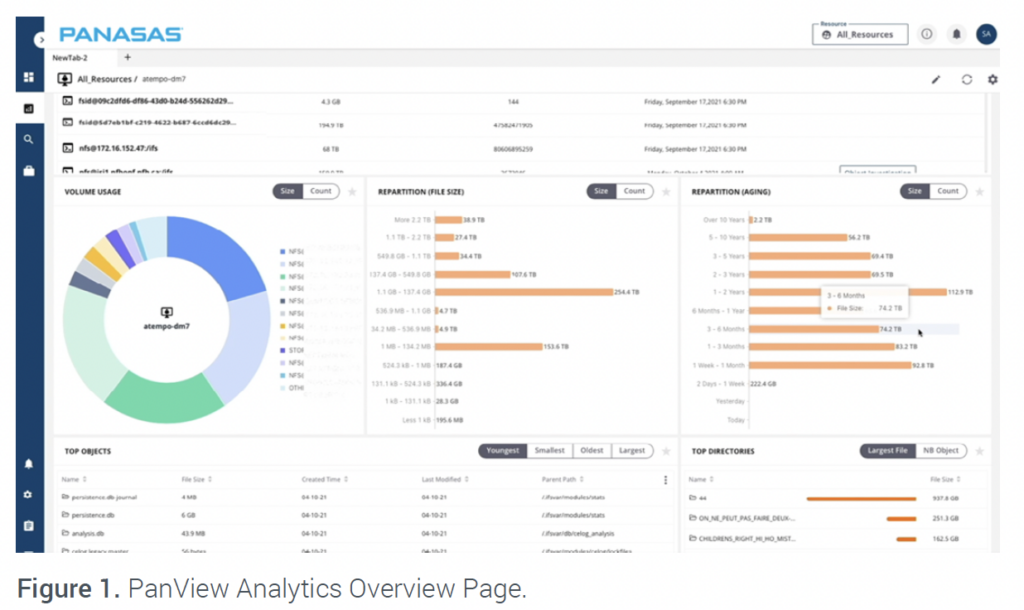
Data Visualization
Data visualization can be defined based on the selected resource, date range, and data exploration range. The metric types are selectable from a predefined list of categories that include:
- Child details – Child details are children of the resource selected.
- Object investigation – This button enables you to inves-tigate the selected object and volumes.
- Volume usage – The volume usage on present child categories is displayed in a pie chart.
- Repartition (file size) – The files that are available for the selected data are categorized by file size in a hori-zontal bar chart (e.g., between the range of 5 GB–10 GB file size there could be a total of 20 GB of files).
- Repartition (aging) – The files that are available for the selected data are categorized by age in a horizontal bar chart (e.g., between the range of 3–5 years duration there could be a total of 10 GB of files).
- Top objects – Top objects consist of most-recent search operations performed on files and directories.
- Top directories – The largest files and directories are displayed with order selectable between the Both/Files/Directories categories to represent the largest files.
Search Query
The Web interface includes an object explorer that allows easy location and identification of files and supports simple and advanced search queries. In addition, filters can be converted into queries.
The search path includes the resource name within which you perform the search. To specify searches, the following fields are supported:
- Field name (e.g., file size).
- Operator (e.g., equal).
- Setting a value (e.g., 5).
Dashboard
PanView Analytics also comes with a dashboard that provides an overview and a customized dashboard section. The dashboard overview, shown in Figure 2 below, displays information on the snapshot taken for the selected resource including:
- Selected resource and its total, occupied and available space.
- Number of resources inside the selected resource.
- Number of directories and files within them.
- Number of platforms and volumes.
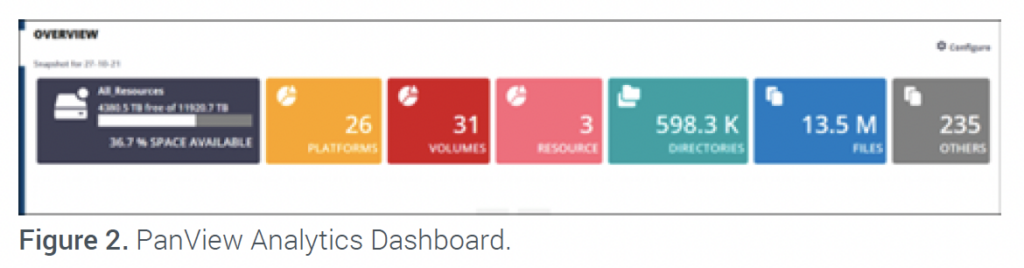
The customized dashboard can show metrics and analytics for a specified resource.
Timely, High-Quality Service and Support
Unlike open-source solutions and even commercial alternatives from broad portfolio vendors, Panasas offers timely, world-class support.
More Information
For more information about PanView Analytics, contact your local Panasas representataive or visit panasas.com/products/panview.
-
High-Performance Data Insight Software for PanFS
High-Performance Data Insight Software for PanFS
Maximizing the value of existing data is critical for high-performance computing (HPC), artificial intelligence, and machine learning (AI/ML) workloads. As unstructured data within organizations continues to scale to petabytes, under-standing that data becomes just as important as storing it.
Data-driven organizations need comprehensive insight into their storage environments to understand their space consumption and asset availability. Compounding this challenge, multiple vendors are often used for storage, creating data silos and storage islands. Organizations that lack insight into their data stores risk losing their competitive advantage.
Panasas provides PanView™ Analytics, a comprehensive and easy-to-use data insight solution for HPC and AI/ML environments that helps organizations extract full value from their data. Combined with the included PanMove™ Advanced soft-ware, users can discover, search, and analyze their data files to mobilize them where and when they are needed. PanMove Advanced and PanView Analytics are the result of a collaboration between Panasas and Atempo, a leading provider of data protection and data management software.
PanView Analytics provides clear analytical information and powerful search capabilities that result in better decision making and reduced operating costs for infrastructure and personnel. Users access PanView Analytics through a single centralized dashboard that presents a global view of Panasas storage systems as well as backup and archive destinations. PanView Analytics provides a graphical representation of the data lifecycle and creates customized reports.
State-of-the-art HPC and AI/ML solutions require storage solutions that are the highest in reliability, scalability, and performance, and they must also be simple to manage. Whether it’s pushing the boundaries in life sciences, manufacturing, energy, financial services, media and entertainment, or academic and government research, Panasas delivers the PanFS parallel file system with the PanFS software suite that includes PanView Analytics for high-performance data insights.
-
PanView Analytics Benefits
PanView Analytics Benefits
- Reduce total cost of ownership (TCO) by optimizing different storage tiers.
- Analyze data usage metrics.
- Identify data via metadata.
- Gain global understanding of storage and data.
-
Take Action
Take Action
With PanView, customers are enabled to act on their infra-structure and data:
- File metadata visibility (date, size, type, etc.).
- Capacity planning and keeping storage costs under control.
- Consolidating storage from multiple silos.
- Identifying “cold” data to transfer to lower-cost storage.
-
View Reports
View Reports
PanView is accessed through a single centralized dash-board:
- Global view of Panasas storage systems and backup and archive destinations.
- Graphical representation of data lifecycle (“hot” and “cold” data).
- Consolidated views and creation of customized reports.
-
ActiveStor Storage Nodes
ActiveStor Storage Nodes
PanView Analytics is supported on ActiveStor® Ultra, ActiveStor® Flash, ActiveStor® Ultra XL, and ActiveStor® Classic storage nodes. All nodes are visible through the same graphical interface.
-
Web Interface
Web Interface
PanView Analytics comes with an easy-to-use Web interface that is includes a navigation pane providing access to the following tabs:
- Dashboard – Present information on the selected resource and customize the dashboard to show metrics and analytics.
- Analytics – Explore and organize metrics for the select-ed time period and resource types.
- Search – Perform advanced file search operations by path, file name and tag.
- Log out – Sign out from the application.
-
Data Visualization
Data Visualization
Data visualization can be defined based on the selected resource, date range, and data exploration range. The metric types are selectable from a predefined list of categories that include:
- Child details – Child details are children of the resource selected.
- Object investigation – This button enables you to inves-tigate the selected object and volumes.
- Volume usage – The volume usage on present child categories is displayed in a pie chart.
- Repartition (file size) – The files that are available for the selected data are categorized by file size in a hori-zontal bar chart (e.g., between the range of 5 GB–10 GB file size there could be a total of 20 GB of files).
- Repartition (aging) – The files that are available for the selected data are categorized by age in a horizontal bar chart (e.g., between the range of 3–5 years duration there could be a total of 10 GB of files).
- Top objects – Top objects consist of most-recent search operations performed on files and directories.
- Top directories – The largest files and directories are displayed with order selectable between the Both/Files/Directories categories to represent the largest files.
-
Search Query
Search Query
The Web interface includes an object explorer that allows easy location and identification of files and supports simple and advanced search queries. In addition, filters can be converted into queries.
The search path includes the resource name within which you perform the search. To specify searches, the following fields are supported:
- Field name (e.g., file size).
- Operator (e.g., equal).
- Setting a value (e.g., 5).
-
Dashboard
Dashboard
PanView Analytics also comes with a dashboard that provides an overview and a customized dashboard section. The dashboard overview, shown in Figure 2 below, displays information on the snapshot taken for the selected resource including:
- Selected resource and its total, occupied and available space.
- Number of resources inside the selected resource.
- Number of directories and files within them.
- Number of platforms and volumes.
The customized dashboard can show metrics and analytics for a specified resource.
-
Timely, High-Quality Service and Support
Timely, High-Quality Service and Support
Unlike open-source solutions and even commercial alternatives from broad portfolio vendors, Panasas offers timely, world-class support.
More Information
For more information about PanView Analytics, contact your local Panasas representataive or visit panasas.com/products/panview.